> ## Documentation Index
> Fetch the complete documentation index at: https://docs.bondata.ai/llms.txt
> Use this file to discover all available pages before exploring further.
# Settings & Usage
> Customize your BonData experience and monitor platform usage
Access settings by clicking **Settings** in the bottom of the sidebar. Here you can customize the look and feel of BonData and track your usage.
## Appearance
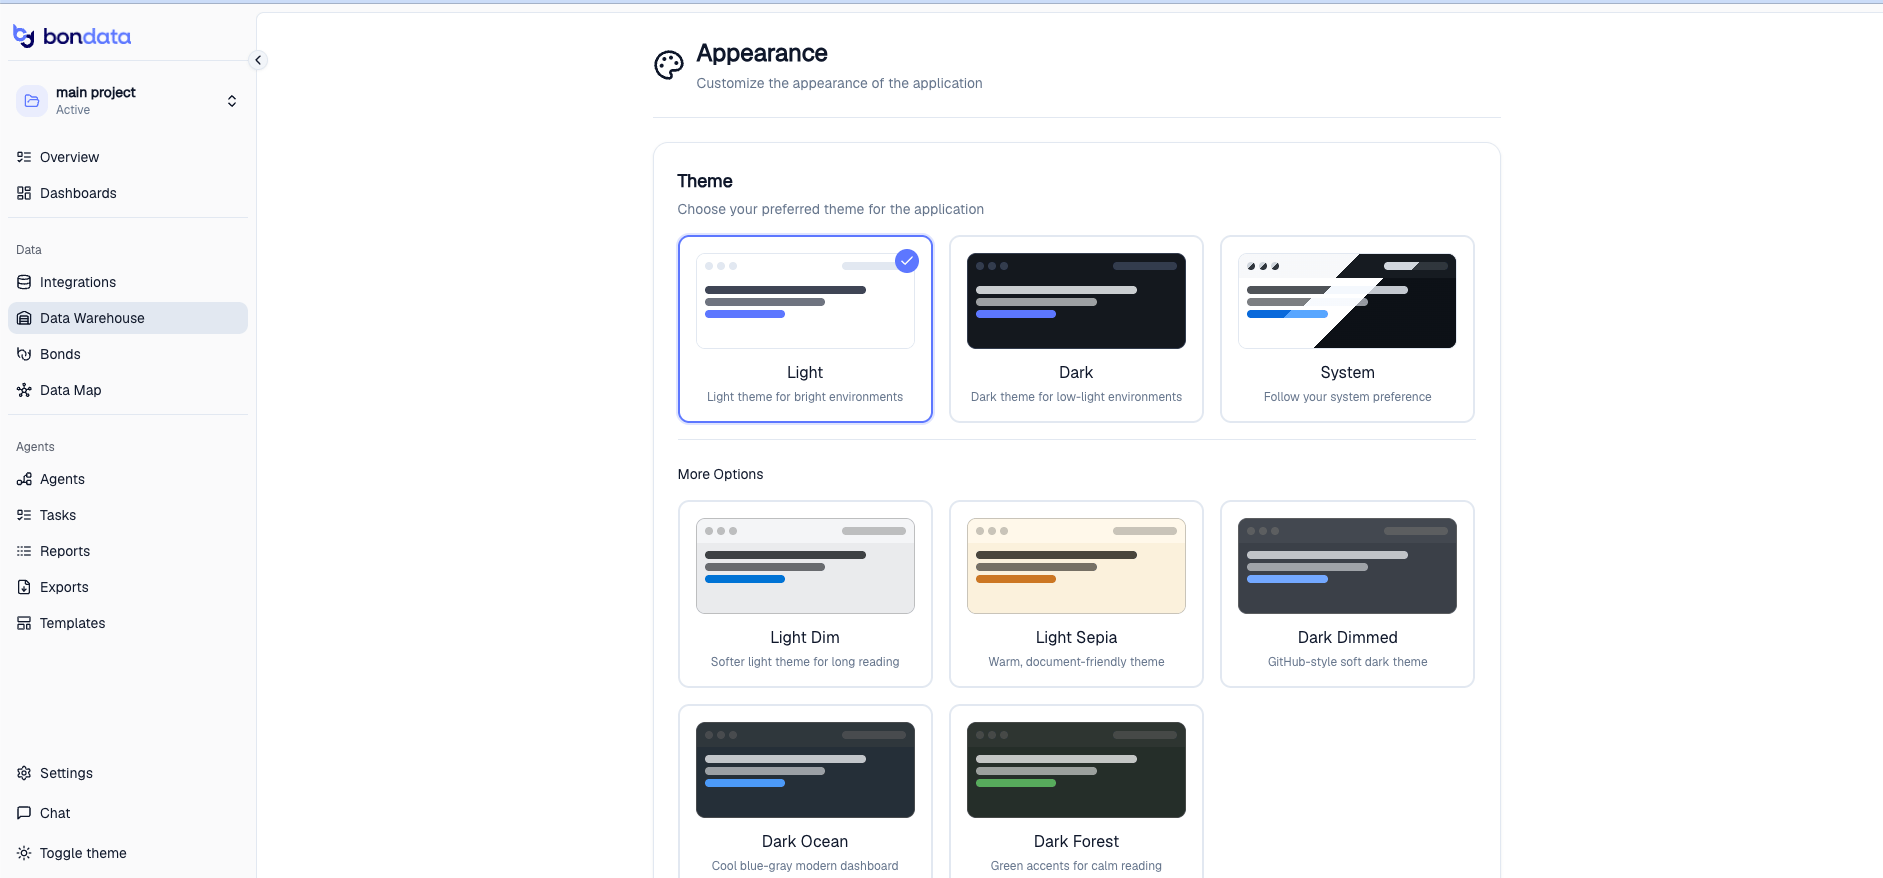
Choose your preferred theme for the application. BonData offers 8 theme options to match your working environment.
 ### Standard themes
| Theme | Description |
| ---------- | ---------------------------------------- |
| **Light** | Light theme for bright environments |
| **Dark** | Dark theme for low-light environments |
| **System** | Follows your operating system preference |
### More options
| Theme | Description |
| --------------- | -------------------------------------------- |
| **Light Dim** | Softer light theme for long reading sessions |
| **Light Sepia** | Warm, document-friendly theme |
| **Dark Dimmed** | GitHub-style soft dark theme |
| **Dark Ocean** | Cool blue-gray modern dashboard |
| **Dark Forest** | Green accents for calm reading |
## Usage Breakdown
Monitor how much data BonData is processing across your integrations. Go to **Settings > Usage** to see a summary and trends.
### Standard themes
| Theme | Description |
| ---------- | ---------------------------------------- |
| **Light** | Light theme for bright environments |
| **Dark** | Dark theme for low-light environments |
| **System** | Follows your operating system preference |
### More options
| Theme | Description |
| --------------- | -------------------------------------------- |
| **Light Dim** | Softer light theme for long reading sessions |
| **Light Sepia** | Warm, document-friendly theme |
| **Dark Dimmed** | GitHub-style soft dark theme |
| **Dark Ocean** | Cool blue-gray modern dashboard |
| **Dark Forest** | Green accents for calm reading |
## Usage Breakdown
Monitor how much data BonData is processing across your integrations. Go to **Settings > Usage** to see a summary and trends.
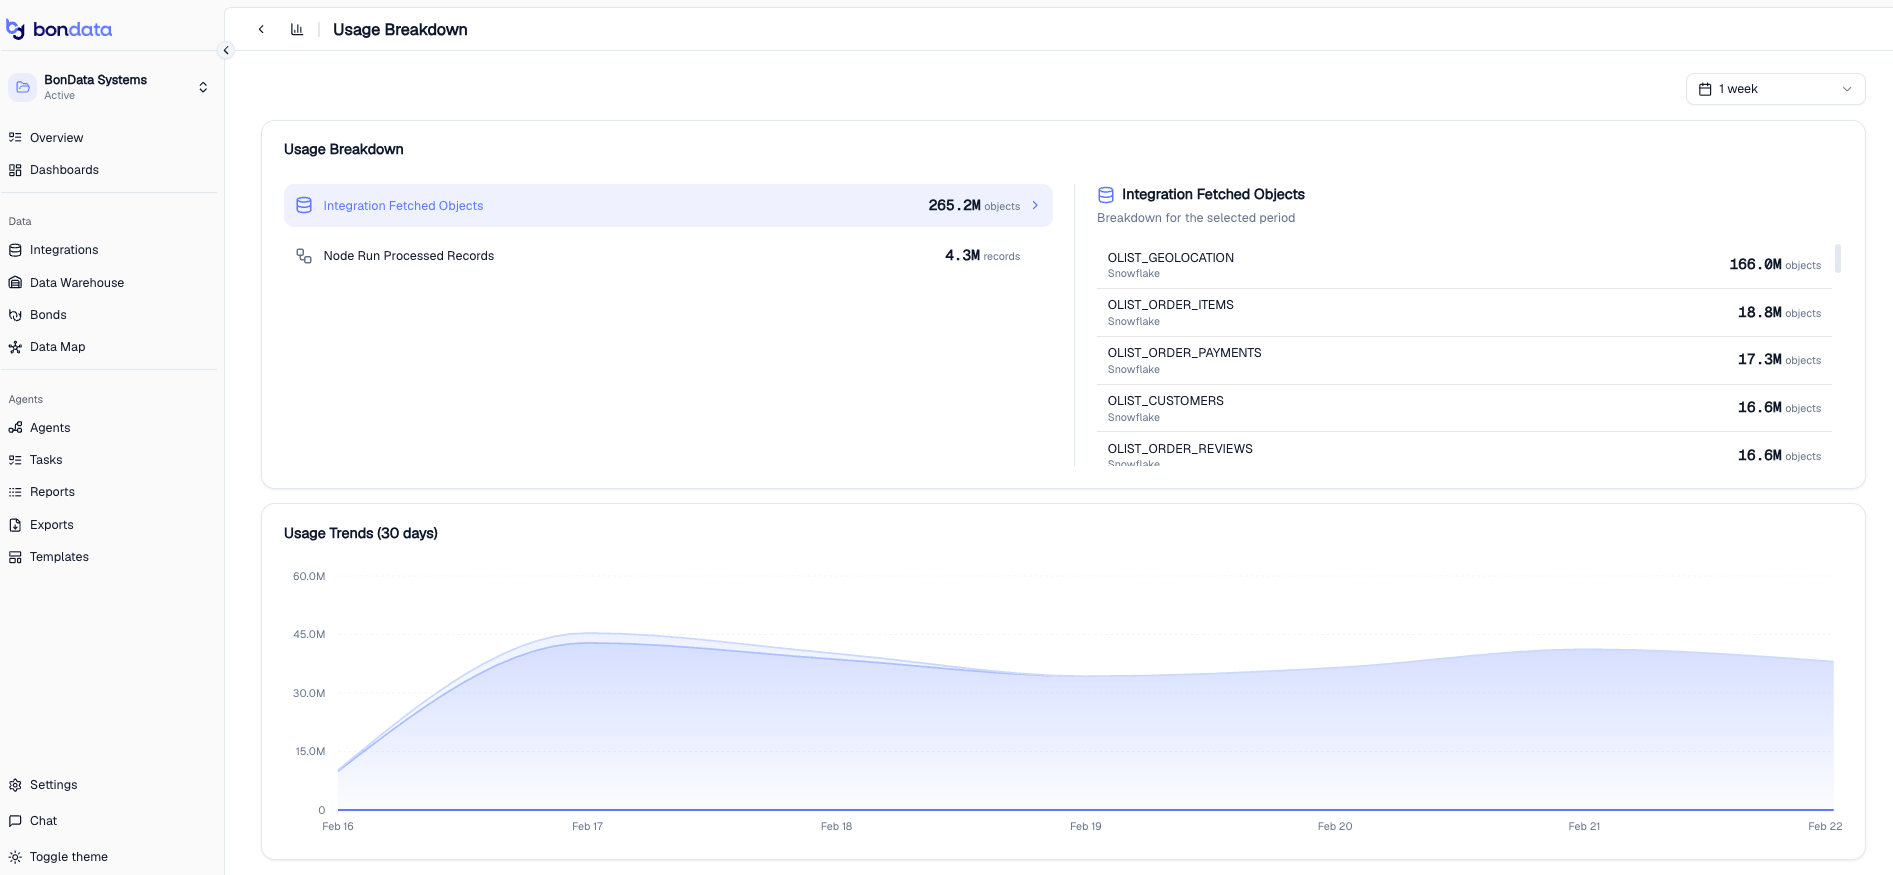 The usage dashboard shows:
* **Integration Fetched Objects** - total number of objects fetched across all integrations, with a per-entity breakdown showing which entities consume the most
* **Node Run Processed Records** - total records processed by Agent node runs
* **Usage Trends (30 days)** - a chart showing how your usage has changed over the past month
Use the time range selector in the top right to filter by **1 week**, **30 days**, or custom periods.
Review your usage regularly to identify integrations or entities that are consuming more resources than expected. You can deactivate unused entities from the integration settings to reduce usage.
The usage dashboard shows:
* **Integration Fetched Objects** - total number of objects fetched across all integrations, with a per-entity breakdown showing which entities consume the most
* **Node Run Processed Records** - total records processed by Agent node runs
* **Usage Trends (30 days)** - a chart showing how your usage has changed over the past month
Use the time range selector in the top right to filter by **1 week**, **30 days**, or custom periods.
Review your usage regularly to identify integrations or entities that are consuming more resources than expected. You can deactivate unused entities from the integration settings to reduce usage.