> ## Documentation Index
> Fetch the complete documentation index at: https://docs.bondata.ai/llms.txt
> Use this file to discover all available pages before exploring further.
# Dashboards
> Group charts onto a single page, each one running its own query
A dashboard is a set of charts arranged on a grid. Each chart holds its own SQL query and runs it when the dashboard opens, so the numbers reflect whatever your integrations hold at that moment. Nothing is stored as a snapshot.
Dashboards belong to a project. Click **Dashboards** in the sidebar to see the ones in the project you're working in.
 ## Create a dashboard
Click **New Dashboard** and give it a name. The description is optional and appears under the title.
You can also describe one in **Chat**. Switch to **Analyst** mode and say what you want to see — for example, *"a revenue dashboard with monthly trend, top products, and a breakdown by region"*. BonData writes the queries, picks chart types, runs each query to check it returns rows, and saves the dashboard. Anything it produces can be edited afterwards.
## Add a chart
Click **Add Widget** to open the chart editor.
## Create a dashboard
Click **New Dashboard** and give it a name. The description is optional and appears under the title.
You can also describe one in **Chat**. Switch to **Analyst** mode and say what you want to see — for example, *"a revenue dashboard with monthly trend, top products, and a breakdown by region"*. BonData writes the queries, picks chart types, runs each query to check it returns rows, and saves the dashboard. Anything it produces can be edited afterwards.
## Add a chart
Click **Add Widget** to open the chart editor.
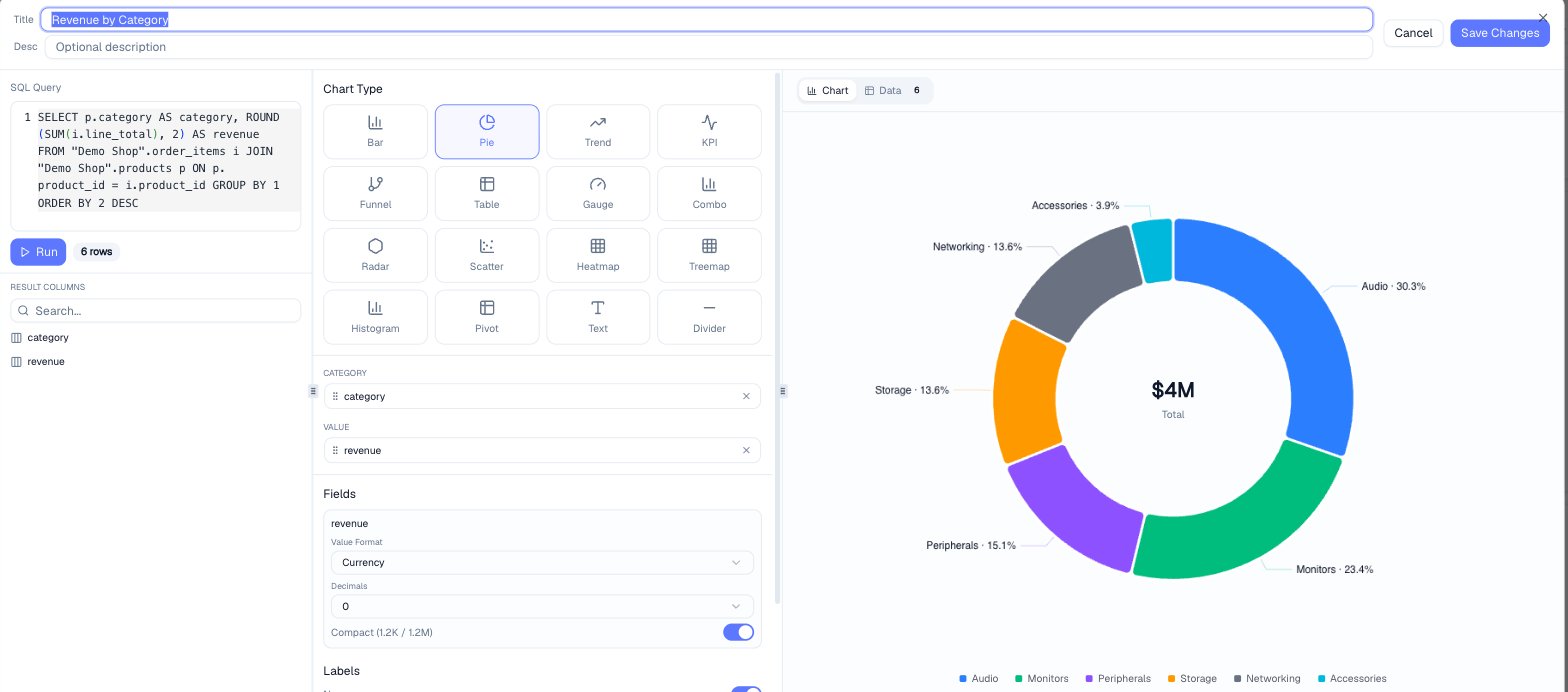 1. Write a query and click **Run**. Reference your data as `"Integration".Entity` — for example `"Demo Shop".orders`. The columns it returns are listed under **Result Columns**.
2. Choose a chart type.
3. Drag columns from **Result Columns** into the chart's slots. A pie takes a **Category** and a **Value**; a bar takes an **X-Axis** and a **Y-Axis**.
4. Set the value format: currency, percentage or number, decimal places, and compact notation (1.2K / 1.2M).
The preview updates as you go.
To change a chart without writing SQL, use **Edit with AI** and describe the change.
## Chart types
| Type | Use it for |
| --------------------- | --------------------------------------------------------------------------- |
| **KPI** | A single number, optionally with a trend arrow or sparkline |
| **Trend** | A measure over time |
| **Bar** | Comparing categories, vertical or horizontal |
| **Combo** | Two measures on shared axes, such as orders as bars and customers as a line |
| **Pie** | Share of a total, as a pie or donut |
| **Funnel** | Drop-off through sequential stages |
| **Gauge** | One value against a range |
| **Table** | Sortable rows with per-column formatting |
| **Pivot** | One dimension cross-tabulated against another |
| **Scatter** | Relationship between two measures |
| **Heatmap** | Density across two dimensions |
| **Treemap** | Nested proportions |
| **Histogram** | Distribution of one measure |
| **Radar** | Several measures compared on one shape |
| **Text**, **Divider** | Headings and separators |
### Turn a KPI into a trend tile
Return one row per period — a month column and a value column — and drag the date column into the KPI's **X-Axis** slot. The tile then shows the latest period's value, a sparkline of the series, and the change against either the first period or the previous one. Give the tile some extra height so the sparkline has room.
## Move and resize charts
Drag a chart by its header to move it. Drag its bottom-right corner to resize it. The grid is 12 columns wide, and the layout saves as you go.
Layout is saved per dashboard, not per person. Rearranging affects everyone who opens it.
## Dashboard filters
Dashboard filters sit above the charts and apply to every chart whose query uses them, so one control moves the whole page. A date range, a region, or a customer segment are typical.
Click **Add filter** and describe what you want to filter by. BonData creates the filter and adds it to the relevant queries. Once a dashboard has at least one filter, the button becomes **Manage filters**, where you can rename them, reorder them, and set defaults.
A filter only affects charts whose query references it. If a chart doesn't move when you change a filter, that chart isn't wired to it — ask AI to add it.
## Chart filters
Individual charts have their own **Filter** button. Pick from the values already present in that chart, or drag across a time axis to narrow to a range.
Chart filters aren't saved and apply only to the chart you're looking at. Use them to inspect something; use a dashboard filter when you want it to persist.
## Chart actions
Hover a chart and open the **⋮** menu.
1. Write a query and click **Run**. Reference your data as `"Integration".Entity` — for example `"Demo Shop".orders`. The columns it returns are listed under **Result Columns**.
2. Choose a chart type.
3. Drag columns from **Result Columns** into the chart's slots. A pie takes a **Category** and a **Value**; a bar takes an **X-Axis** and a **Y-Axis**.
4. Set the value format: currency, percentage or number, decimal places, and compact notation (1.2K / 1.2M).
The preview updates as you go.
To change a chart without writing SQL, use **Edit with AI** and describe the change.
## Chart types
| Type | Use it for |
| --------------------- | --------------------------------------------------------------------------- |
| **KPI** | A single number, optionally with a trend arrow or sparkline |
| **Trend** | A measure over time |
| **Bar** | Comparing categories, vertical or horizontal |
| **Combo** | Two measures on shared axes, such as orders as bars and customers as a line |
| **Pie** | Share of a total, as a pie or donut |
| **Funnel** | Drop-off through sequential stages |
| **Gauge** | One value against a range |
| **Table** | Sortable rows with per-column formatting |
| **Pivot** | One dimension cross-tabulated against another |
| **Scatter** | Relationship between two measures |
| **Heatmap** | Density across two dimensions |
| **Treemap** | Nested proportions |
| **Histogram** | Distribution of one measure |
| **Radar** | Several measures compared on one shape |
| **Text**, **Divider** | Headings and separators |
### Turn a KPI into a trend tile
Return one row per period — a month column and a value column — and drag the date column into the KPI's **X-Axis** slot. The tile then shows the latest period's value, a sparkline of the series, and the change against either the first period or the previous one. Give the tile some extra height so the sparkline has room.
## Move and resize charts
Drag a chart by its header to move it. Drag its bottom-right corner to resize it. The grid is 12 columns wide, and the layout saves as you go.
Layout is saved per dashboard, not per person. Rearranging affects everyone who opens it.
## Dashboard filters
Dashboard filters sit above the charts and apply to every chart whose query uses them, so one control moves the whole page. A date range, a region, or a customer segment are typical.
Click **Add filter** and describe what you want to filter by. BonData creates the filter and adds it to the relevant queries. Once a dashboard has at least one filter, the button becomes **Manage filters**, where you can rename them, reorder them, and set defaults.
A filter only affects charts whose query references it. If a chart doesn't move when you change a filter, that chart isn't wired to it — ask AI to add it.
## Chart filters
Individual charts have their own **Filter** button. Pick from the values already present in that chart, or drag across a time axis to narrow to a range.
Chart filters aren't saved and apply only to the chart you're looking at. Use them to inspect something; use a dashboard filter when you want it to persist.
## Chart actions
Hover a chart and open the **⋮** menu.
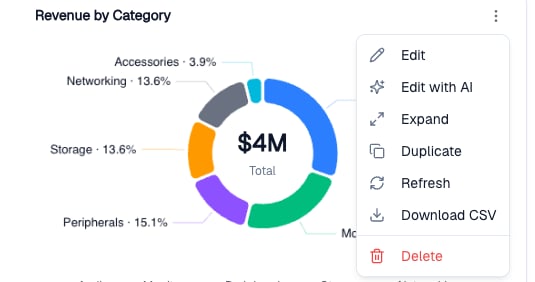 | Action | Result |
| ---------------- | --------------------------------------------- |
| **Edit** | Opens the chart editor |
| **Edit with AI** | Describe the change in plain language |
| **Expand** | Full-screen view |
| **Duplicate** | Copies the chart onto the same dashboard |
| **Refresh** | Re-runs the query, ignoring any cached result |
| **Download CSV** | Exports the rows behind the chart |
| **Delete** | Removes the chart |
The **``** button beside the menu shows the chart's query and lets you edit it directly.
## Export a dashboard
| Action | Result |
| ---------------- | --------------------------------------------- |
| **Edit** | Opens the chart editor |
| **Edit with AI** | Describe the change in plain language |
| **Expand** | Full-screen view |
| **Duplicate** | Copies the chart onto the same dashboard |
| **Refresh** | Re-runs the query, ignoring any cached result |
| **Download CSV** | Exports the rows behind the chart |
| **Delete** | Removes the chart |
The **``** button beside the menu shows the chart's query and lets you edit it directly.
## Export a dashboard
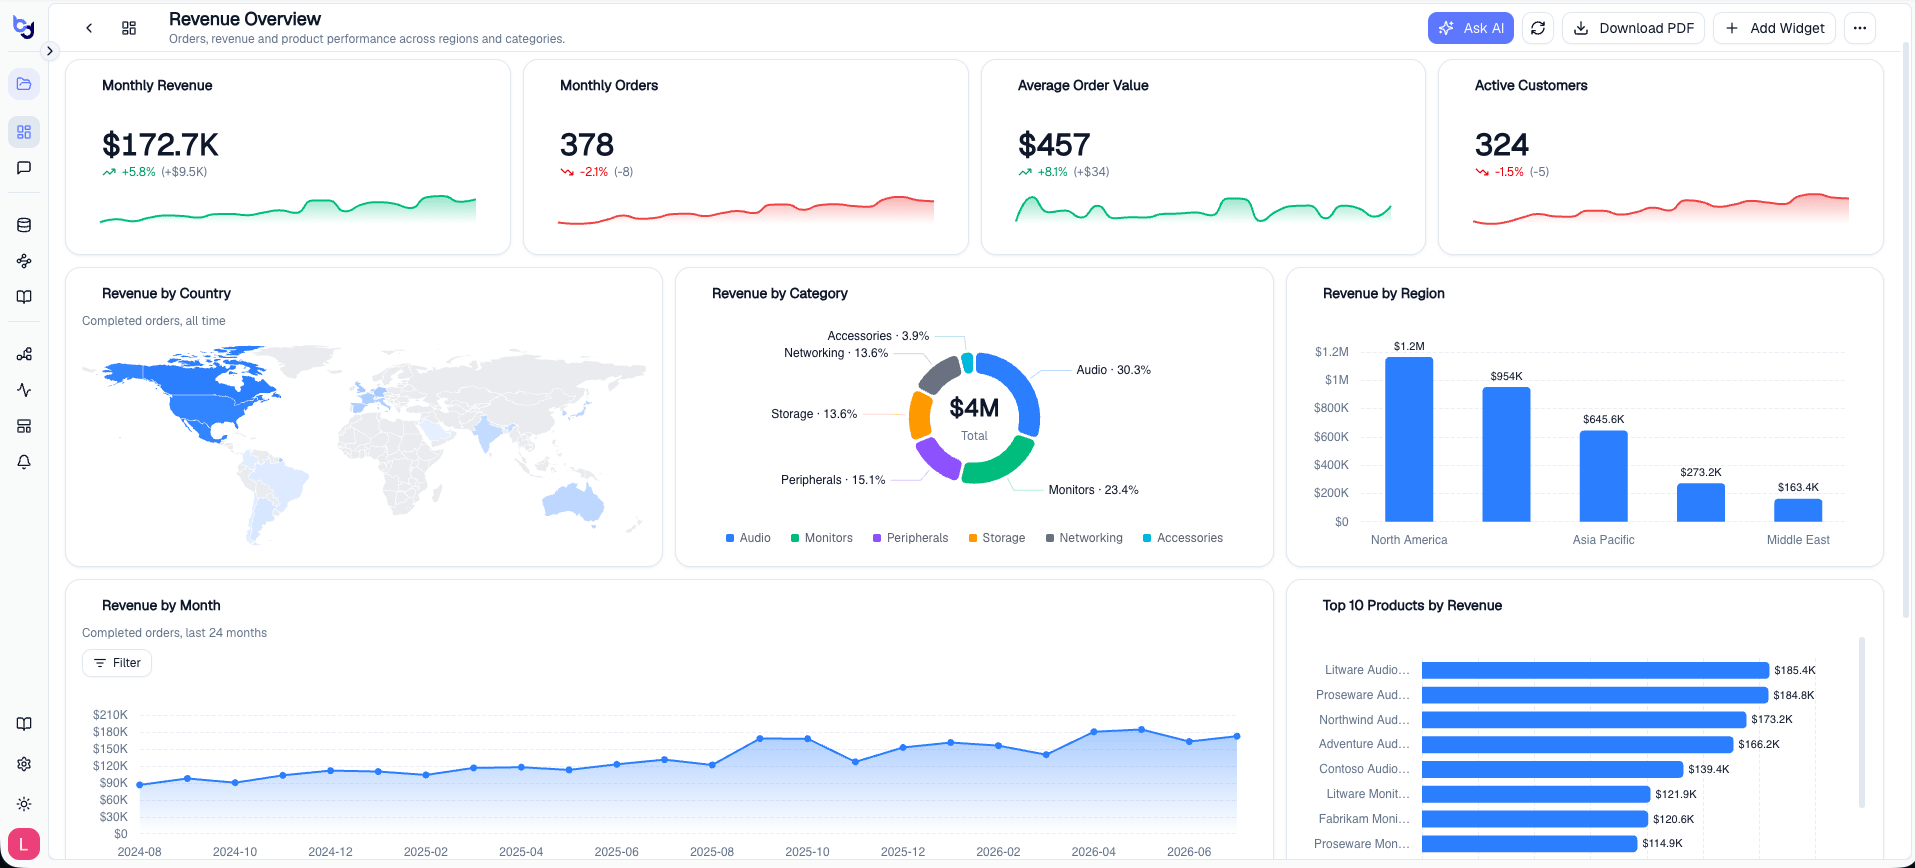
 **Download PDF** captures the dashboard as it appears on screen, including charts below the fold.
**Ask AI** opens Chat beside the dashboard, so you can ask about what you're looking at or change charts and watch them re-render.
The **⋯** menu holds **Manage Filters**, **Duplicate Dashboard**, and **Delete Dashboard**.
**Download PDF** captures the dashboard as it appears on screen, including charts below the fold.
**Ask AI** opens Chat beside the dashboard, so you can ask about what you're looking at or change charts and watch them re-render.
The **⋯** menu holds **Manage Filters**, **Duplicate Dashboard**, and **Delete Dashboard**.
 ## Further reading
* [AI Chat](/guide/chat/ai-chat) — building and editing dashboards from a conversation
* [Connecting your integrations](/guide/getting-started/connecting-integrations) — the sources charts query
* [Bondata Cloud](/guide/data-warehouse/bondata-cloud) — where queried data is stored
## Further reading
* [AI Chat](/guide/chat/ai-chat) — building and editing dashboards from a conversation
* [Connecting your integrations](/guide/getting-started/connecting-integrations) — the sources charts query
* [Bondata Cloud](/guide/data-warehouse/bondata-cloud) — where queried data is stored